
Dashboard

Nirvana
Nirvana automates C-store POG and assortment reporting, reducing manual effort and enabling scalable, flexible insights for evolving business needs.

Nirvana automates C-store POG and assortment reporting, reducing manual effort and enabling scalable, flexible insights for evolving business needs.

The ODD Sales Dashboard consolidates sales and unit volume data to deliver insights on year-over-year growth, brand and pack-type performance, and retailer contributions to RSV. It also identifies the proportion of incremental orders, en...

The 1CPL Automation Dashboard automates the extraction of COGS data directly from SAP, eliminating reliance on flat files. It also enables SAP customer document mapping from the data lake and facilitates D&E data extraction in alignm...

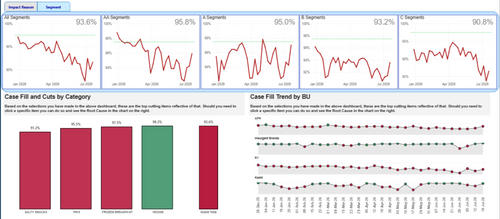
Shows daily orders, shipments and cuts at item location level with roll ups to brand and business unit

A one-stop shop to measure performance and diagnose opportunities at Retail and Supporting Sales Functions including shipment, consumption, inventory, on-shelf availability, retail sales effectiveness and day 1 readiness.

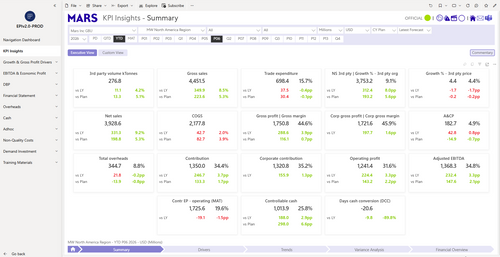
EP&I Analytics is a global PBI tool from BPS Team, focused on high level management reporting.

The GTM Reporting tool enhances report accuracy by adding custom fields required for complex calculations. These improvements increase the reliability and precision of go-to-market analytics and performance measurement.
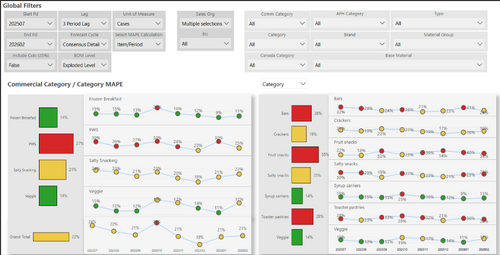

The Ice Cream Daily Sales Report replaces a manual Excel-based system with a dynamic, automated dashboard. The new system provides timely, accurate daily sales insights aligned with DSRM targets, improving efficiency for both Sales and S...

The Ice Cream Perfect Store dashboard tracks performance against Key Performance Indicators across the U.S. Mars Ice Cream Sales business. It aggregates and visualizes points awarded for in-store execution, channel compliance, and sales ...
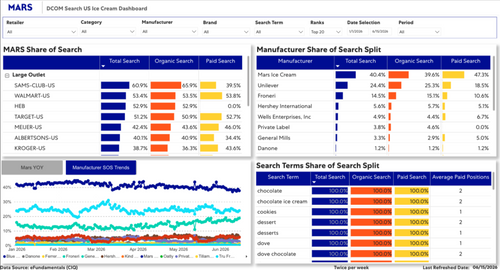
Ice Cream Search Dashboard consolidates search rankings and allows users to deep dive into SEO by customer and time period.
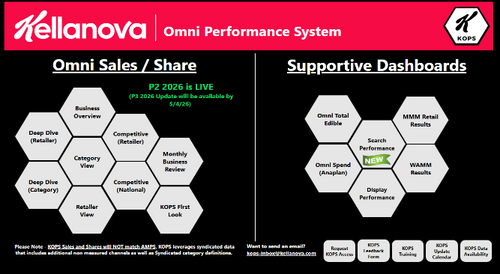
KOPS, short for Kellanova Omni Performance System, is a centralized dashboard built to unify in-store and online performance data across retailers, enabling smarter, faster decision-making. KOPS combines 50+ sources, Including Nielsen Om...


The M&M Scorecard automates the War Room and Building Block Tracker reporting processes, transitioning from manual PowerPoint-based reporting to an integrated system powered by Nielsen data. It enables timely tracking of historical s...

The MAC Tool enables users to perform end-to-end analysis within a single platform, eliminating the need for external data manipulation. It automates data inputs—including Canada market data—and integrates with the data lake for a mo...
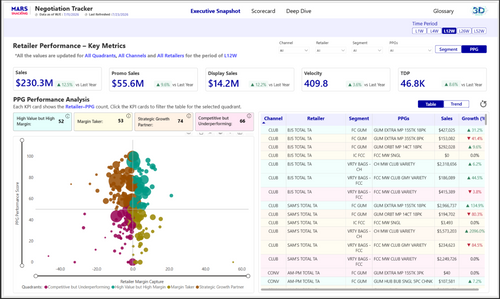
The objective of Negotiation Tracker is to broaden performance visibility through rolling and cumulative timeframes (Latest 1, 4, 12, 26, and 52 Weeks) with year-ago comparisons, expand analytical coverage from a single KPI to a comprehe...

The Pathfinder Account Assortment report transitions the CBP Account Assortment data from legacy systems (CAS and Salesforce) to a unified data lake environment. This migration supports enhanced data availability, phased system upgrades,...

The Pathfinder Adhoc Reporting solution consolidates KPIs across multiple datasets into a single flexible platform. It empowers users with customizable visualizations and self-service analytics, enabling quick generation of ad hoc insigh...

The Pathfinder CPR dashboard provides a comprehensive, interactive view of payment-related KPIs across dimensions such as Year, Period, Account, and Payment attributes. It combines high-level visual summaries with detailed records to sup...

The Pathfinder Incremental Promos dashboard migrates promotional performance reports from CAS to Salesforce, ensuring validation of metrics, consistency in calculation logic, and alignment with the new Z Hierarchy. This enhances visibili...

The Pathfinder R2D2 tool standardizes baseline calculation methodologies and provides visibility into business decisions related to baseline modifications. It enables automated baseline generation with options for user adjustments, ensur...

The Pathfinder (TST) provides an integrated, transparent platform for managing trade spend budgets. It enhances visibility for Key Account Managers (KAMs), enabling proactive monitoring of spend, early detection of potential overruns, an...

The Portfolio Health tool helps us to evaluate our portfolio health and understand how to improve commercial performance in the Canadian market.
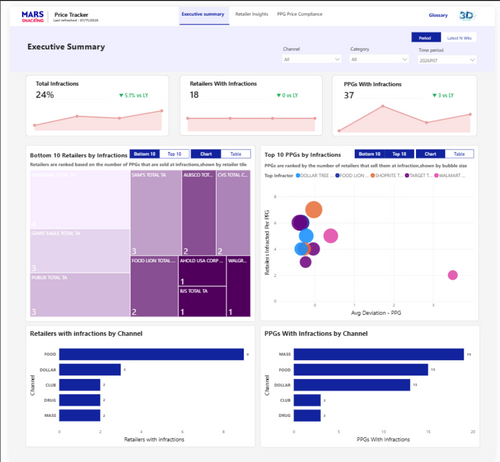
Dashboard that enables proactive monitoring and enforcement of pricing compliance across retailers and PPGs. It helps to Clearly understand retail pricing strategies in the market and accelerate speed to resolution when pricing tensions ...

Business critical application used across multiple business units to support customer P&Ls, trade, performance, KPIs, and analytics.
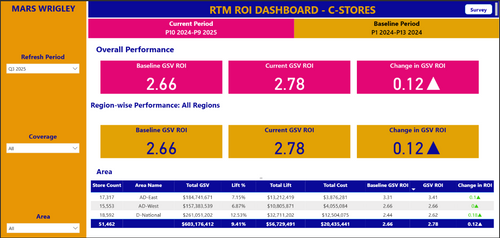
Measures ROI of RTM strategies, providing actionable insights for efficient planning and resource allocation across regions.
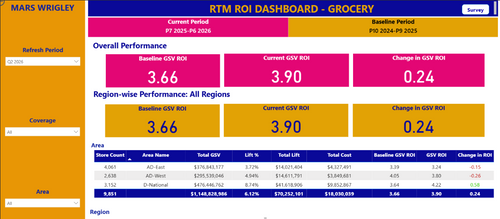
Measures ROI of RTM strategies, providing actionable insights for efficient planning and resource allocation across regions.
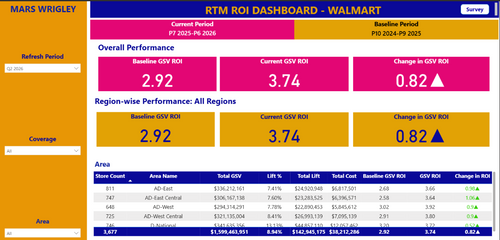
Measures ROI of RTM strategies, providing actionable insights for efficient planning and resource allocation across regions.
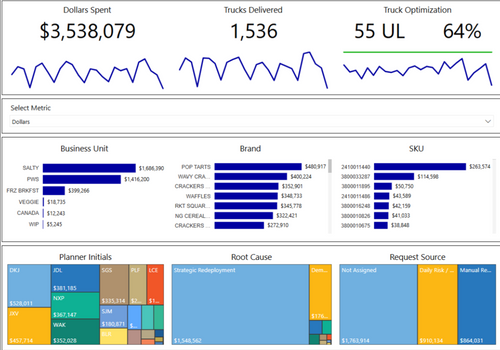
Shows amount of money spent on redeployment with various views across items/brands/locations/business units

The S&OP+ Dashboard standardizes KPI identification, data collection, and visualization across planning processes. It integrates data sources into a centralized repository and provides a digital scorecard with access to key metrics, ...
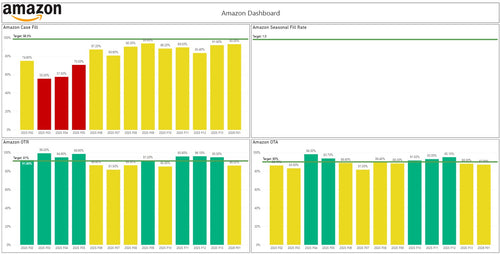
The SAMBC Dashboard contains all required information to support the SAMBC process.
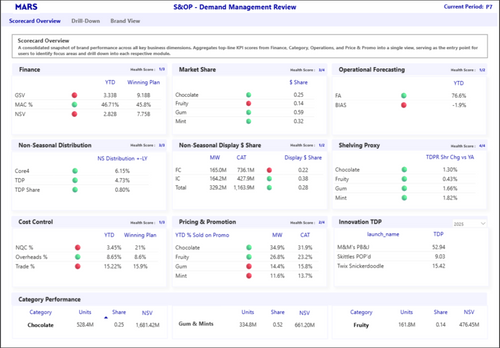
The SDRM Scorecard is a centralized performance management solution that provides a single, consistent view of key business KPIs across Strategic Demand & Revenue Management (SDRM). It enables monitoring of financial performance, mar...
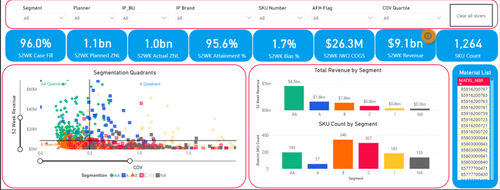
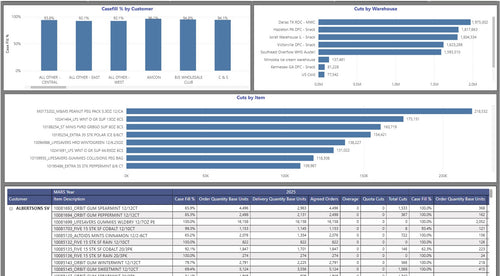
The SPM US MW AERA dashboard provides a service view including automated root cause reason codes, facilitating analysis and resolution of service issues.
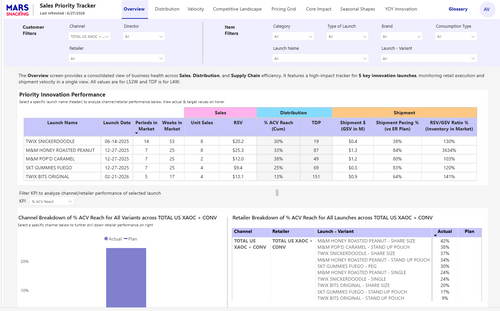
The Sales Priority Tracker aligns multiple functions—Sales, Marketing, Supply, and Internal Sales—under a unified reporting framework. It tracks progress on annual “Big Bets” and innovation products, ensuring cross-functional consistency...

DCOM Search Dashboard consolidates search rankings and allows users to deep dive into SEO by customer and time period.
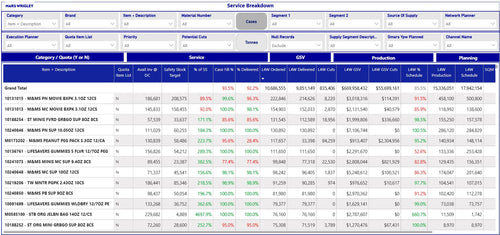
The Service Breakdown Dashboard collects multiple metrics at the item level to understand drivers of service misses, enabling targeted improvements in service delivery.
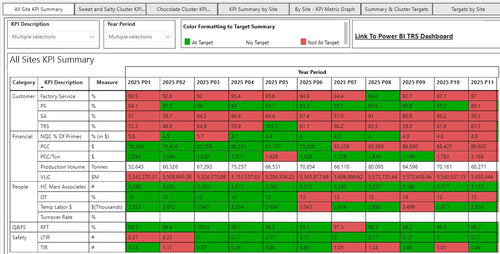
This dashboard provides a periodic scorecard used to view major KPIs at the site and cluster level.
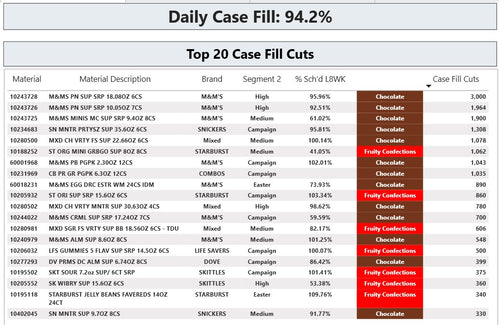
The Top 20 Cuts Dashboard shows the top 20 cuts from the previous day with item, cell, and customer views available, helping monitor service issues.
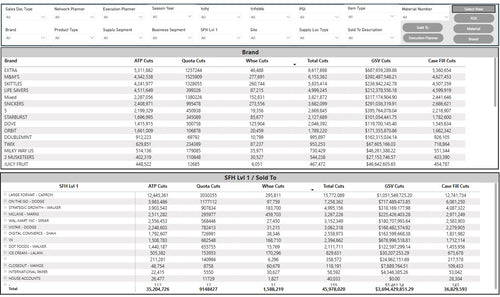
The Total Cuts Dashboard provides detailed information on all service cuts, enabling teams to understand and address service interruptions effectively.

The US MW Hygiene Dashboard integrates new SAP data fields to improve hygiene metrics and ensure complete visibility of product and process compliance. It enhances accuracy in reporting and supports ongoing performance and audit requirem...
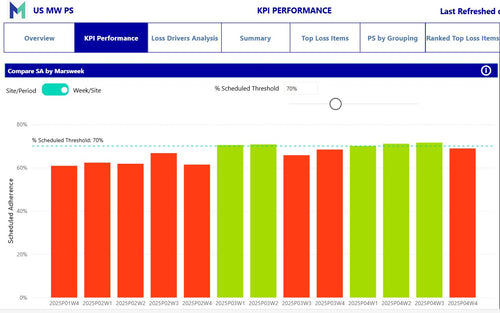

The US MW Perfect Store 2025 dashboard enhances KPI calculations related to distribution trends by incorporating updated Nielsen facts. It localizes results against Key Performance Indicators, providing a holistic view of channel and tot...

The USMW Forecasting Toolkit supports demand planning segmentation and Forecast Value Added (FVA) analysis.

The Universal Drilldown Report consolidates category-level diagnostic reporting into a single automated system, eliminating manual Nielsen data pulls. It simplifies analysis for category managers, improves data integrity, and enables rap...

The Walmart Inventory Tool provides real-time visibility into inventory levels, historical POS data, and weeks-of-supply metrics through an interactive Power BI dashboard. It enables users to drill down from national to store or item lev...

The YOY Rehandling dashboard provides a detailed view of all shipments and the resulting cost of product that has been rehandled, supporting cost control efforts.