Dashboard
S&OP + Dashboard
S&OP + Dashboard
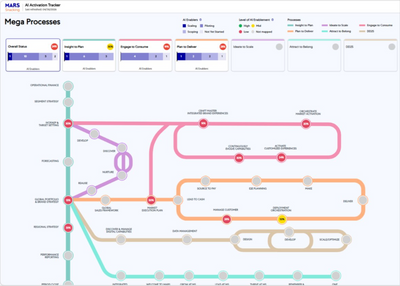
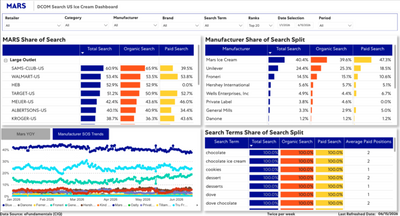
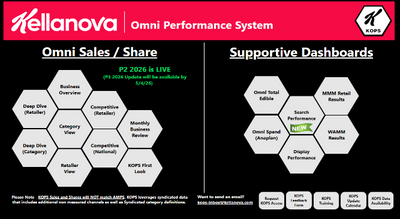
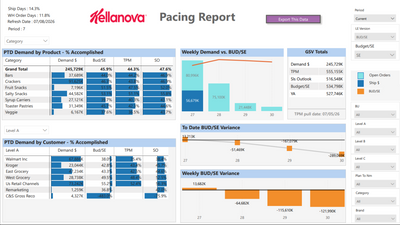
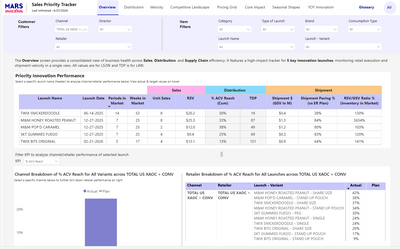
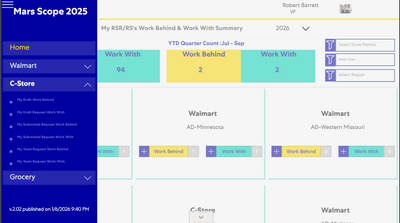
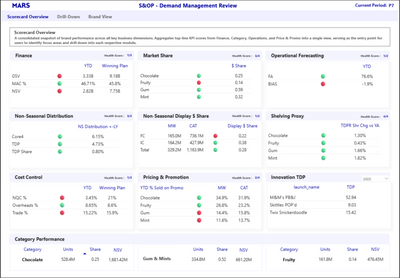
The S&OP+ Dashboard standardizes KPI identification, data collection, and visualization across planning processes. It integrates data sources into a centralized repository and provides a digital scorecard with access to key metrics, targets, and historical trends. The platform supports continuous improvement through stakeholder training and feedback-driven enhancements.
Key Questions Answered
Everything users usually ask, covered here.
- What are the critical KPIs driving S&OP performance?
- How aligned are actuals versus targets across functions?
- How can data-driven visibility improve planning accuracy and responsiveness?

You May Also Like
-
Dashboard

-
Digital App

-
Digital App

-
Digital App

-
Podcast

-
Podcast

-
Digital App
-
Podcast

-
Dashboard

-
Digital App
-
Digital App
-
Digital App

-
Podcast

-
Dashboard

-
Digital App

-
Dashboard

-
Digital App

-
Podcast

-
Dashboard

-
Digital App

-
Dashboard

-
Digital App

-
AI Tools
-
Podcast

-
Dashboard

-
Dashboard

-
Course

-
Dashboard

-
AI Tools

-
Dashboard

-
Course

-
Digital App

-
Digital App

-
Dashboard

-
Dashboard

-
Dashboard

-
Dashboard

-
Dashboard

-
Dashboard
-
Dashboard

-
Dashboard

-
Dashboard
-
Dashboard

-
Dashboard

-
Digital App

-
AI Tools

-
AI Tools

-
Podcast

-
Dashboard

-
Dashboard

-
Dashboard

-
AI Tools
-
Dashboard

-
Dashboard

-
Dashboard

-
Dashboard

-
Dashboard

-
Dashboard

-
AI Tools
-
Dashboard

-
Dashboard

-
Dashboard
-
Dashboard

-
Dashboard

-
Dashboard

-
Dashboard

-
Dashboard

-
Digital App

-
Dashboard

-
Digital App

-
Dashboard

-
Digital App

-
Dashboard

-
Dashboard

-
Dashboard

-
Dashboard

-
Dashboard

-
Dashboard

-
Dashboard

-
Dashboard
-
Dashboard

-
Digital App
-
Dashboard
-
Dashboard

-
Dashboard

-
Digital App

-
Dashboard

-
Dashboard

-
Podcast

-
Podcast

-
Digital App
-
Podcast

-
Dashboard

-
Dashboard

-
Dashboard

-
Dashboard

-
Dashboard

-
Dashboard

-
Dashboard

-
Dashboard

-
Dashboard

-
AI Tools

-
AI Tools

-
Dashboard